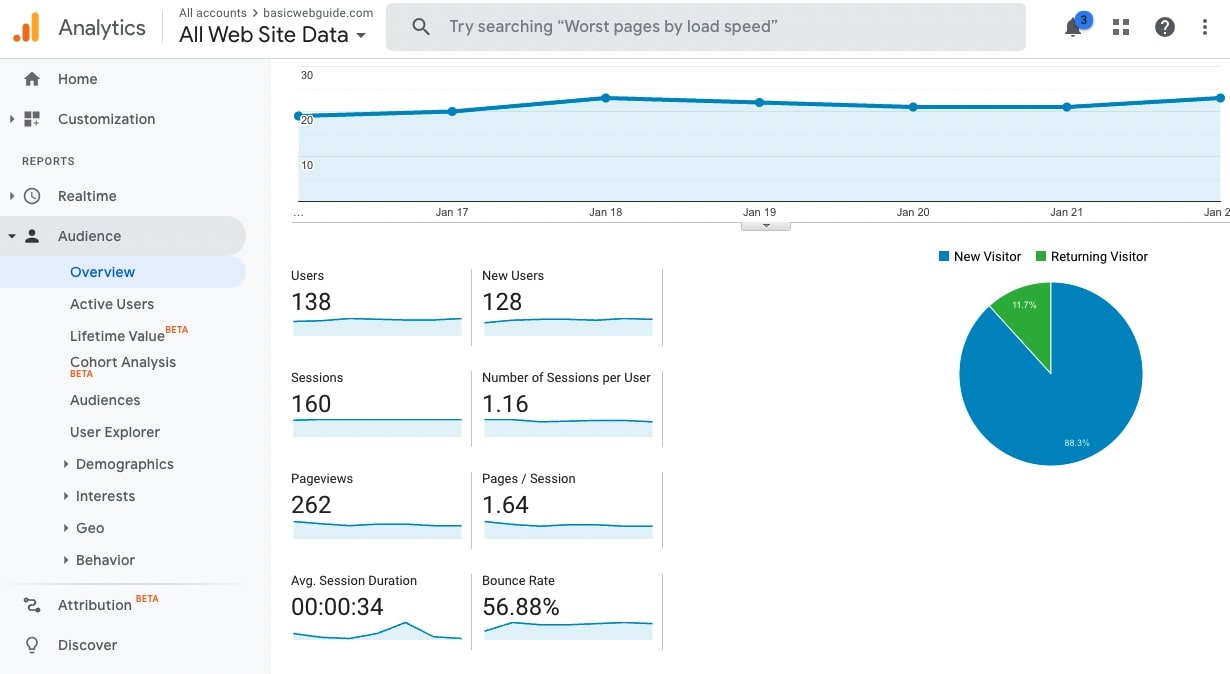
Google Analytics is essential to track the website’s traffic by using different “metrics” in it. Today in this article, you will learn What is a metric in Google Analytics? How a Google Analytics metric can affect the overall performance of the website.
Google Analytics has more than 200 “metrics,” including sessions, session duration, conversion rates, etc., but you must know which “metrics” are more important for your business goals. This is why it’s recommended to analyze the Google Analytics data by using appropriate “metrics” according to your need.
What is a Metric in Google Analytics?
According to Google Analytics itself, “Metrics are quantitative measurements of your site data” in most simple words.
Metrics are not measured alone and are most commonly analyzed with dimensions in the form of sum or ratios. Metrics have calculated either statistics of the complete site or by associate with a single dimension.

It can be understood with a simple example; a metric ‘Population‘ associated with a dimension ‘City‘ where the population is the whole sum of the residents of that particular city. Similarly, as shown in the above example, a single dimension can be associated with two or more metrics.
Similarly, most dimensions (not all) are paired with a particular metric and present consolidated reports to the users.
The website admin analyzes these reports to analyze their traffic, conversions, and user behaviors. So now you get a basic idea of What is a metric in Google Analytics; let me bust some confusion/questions arising in your minds.
- Read Also –
What is the difference between dimensions and metrics in Google Analytics?
Metric and dimensions are interrelated as both go hand-on-on, so it is pretty common to have this question in mind.
We already discussed that metric is a quantitative measurement while on the other hand dimensions are non-numerical data, can say qualitative measurements. Dimension can also be termed as categories or attributes to the metrics.
When these two data records are combined, it gives a broader context to the users, including real-time visitors, traffic, user engagement of the website with a given date range (7 days, 28 days, 90 days, etc.). It provides an approximate date range perspective of a website.
Most commonly, dimensions are structured at rows while metrics are valued into columns.
How are metrics calculated?
Let’s understand how a “metric” is calculated. It is calculated generally using two basic ways:
- As Overview: In this way, a metric, such as bounce rate or pageviews, is displayed as summary statistics of the whole site.
- As an association with one or more reporting dimension(s): In this way, metric value is quantified by selected dimension.
Calculations are done using the time differences of different users’ initial & exit sessions as well as the sum of all sessions. Therefore, the metrics calculation is affected by stacking more than one dimension with a given metric.
Useful metrics in Google Analytics
Till now, we learned What is a metric in Google Analytics. So now let’s have a look over 7 useful and essential metrics in Google Analytics.

- The number of users- Users are the number of visitors on your site in a specific time interval or real-time users. Usually, one user represents one visitor, although Google considers 1 user each of desktop and mobile as 2 visitors.
- Source of traffic- This is the most important metric of any website. It reveals where the traffic came from; Facebook, Twitter, Pinterest, Instagram, and other platforms like direct or organic traffic. It helps to understand user behavior.
- The number of Sessions- The number of sessions determines how actively users engage with the content or site. A number of sessions indicate how many times a user hits your website. For example, if the sessions are showing 50 while the visitors are 5, then it means each user visits your site 10 times.
- New users- This is another crucial metric of Google Analytics. New users are the users that never visited your site before. It is useful to know your website’s audience engagement and branding level. User metrics tell where the new users came from and the site’s reach.
- Bounce rate- Bounce rate is defined as how immediately a visitor lands and leaves a page, sometimes without completing the task. Google Analytics illustrates bounce rate in the form of a percentage. There is a general perception of a high bounce rate as a negative aspect, but it is not always bad except if it is from the homepage.
- Average session duration- This is the time or duration a visitor spends on your website. The average session duration is inversely proportional to bounce rate and increases if users find related content on the website.
- Pageviews Vs. Unique Pageviews- This self-explanatory metric is the most important metric in Google Analytics. They sometimes look similar but have a deep difference among them. Pageviews are the total page views at a time; even if the same user visits the site many times, it counts separately. While this is not the case of unique pageviews, it means when a user visits the website 5 times, it is still counted as one pageview.
Final Words
I hope you like this article on What is a metric in Google Analytics, and you can track a metric. Metrics and dimensions are the two different aspects of a single origin; Google Analytics.
Although, website owners pay less attention to the metric or other tiny information. But these data play a significant role in the development of a website.
We discussed the top 7 most important metrics of Google Analytics that must be used to analyze user behavior. If these “metrics” are correctly analyzed, you can improve the traffic and reduce the bounce rate.
Both metrics or dimensions are critical data to comprehensively analyze as a full report and track the website visitors. If you have any confusion or question, please let me know in the comments.


